The Coastal Salinity Index (CSI) was developed to characterize coastal drought, monitor changing salinity conditions, and improve understanding of the effects of changing salinities on fresh and saltwater ecosystems, fish habitat, and freshwater availability for municipal and industrial use.
Coastal drought is unique in its effects on the salinity dynamics of creeks, rivers, and estuaries. The location of the freshwater-saltwater interface within coastal water bodies regulates the ecological and socioeconomic dynamics of coastal communities. Commonly used drought indices characterize hydrological, agricultural, and meteorological conditions; however they do not incorporate salinity, a key stressor associated with coastal drought. Salinity is a critical variable for measuring drought response that integrates hydrologic and coastal dynamics including sea level, tides, winds, precipitation, streamflow, and tropical storms.
The motivation for a coastal drought index came from the National Integrated Drought Information System (NIDIS) Drought Early Warning System (DEWS) for coastal North Carolina and South Carolina. The recommendation for an indicator that would be appropriate for assessing and characterizing drought conditions in coastal areas came out of the initial Coastal Carolinas DEWS Scoping Workshop in 2012. The Coastal Carolina DEWS activities focused on improving the understanding of drought effects on coastal environmental resources and developing information to enhance drought monitoring and planning processes. In 2020, the Coastal Carolinas DEWS was was incorporated into a new NIDIS— Southeast DEWS. The expanded DEWS will facilitate information sharing across a broader geography and enhance collaborations among federal, regional, state, and local agencies working in the region.
For more information on the need for an index of coastal drought see: Needs Assessment of Coastal Land Managers for Drought Onset Indicators in the Southeastern United States.
Conrads and Darby (2017) developed the CSI using an approach similar to the Standardized Precipitation Index (SPI), a readily available drought index that is widely used for monitoring meteorological droughts (McKee and others, 1993). The CSI substitutes total monthly precipitation with monthly mean salinity data to determine the probability of recording a given salinity value in a particular month. For the CSI, monthly mean salinity data are fit to a gamma distribution and then normalized (mean of zero and standard deviation of one). The index values are standard deviations from the normalized mean values. To align the CSI values with the same classification scheme as the U.S. Drought Monitor, the CSI values were multiplied by -1 so that negative numbers represent drought conditions.
An index value of zero indicates historical mean salinity; negative and positive values represent increasingly saline and fresh conditions, respectively. Typical SPI threshold values were adopted for the coastal drought classifications. The thresholds characterize the historical range of measured salinity data at the site and provide an indication of the severity of the saline (or freshwater) conditions over the interval for which the CSI was computed. As with the SPI, the CSI can be computed for various time intervals, allowing the CSI to be used to evaluate and compare short- and long-term drought (saline) and wet (freshwater) conditions.
Currently, the CSI is calculated at time intervals of one month or longer. The CSI depicts the response to monthly (and longer) precipitation and streamflow conditions rather than hourly to daily salinity fluctuations. To view salinity and temperature data at shorter time intervals, visi the Additional Data page.
CSIs were calculated for coastal gages that are operated by the U.S. Geological Survey, National Estuarine Research Reserve System, or U.S. National Park Service that had a continuous record of real-time mean salinity data for at least approximately 18 years. CSIs can be calculated for other datasets or different intervals by utilizing the CSI R package, available on GitLab.
References:
Conrads, P.A. and L.S. Darby, 2017, Development of a Coastal Drought Index Using Salinity Data. Bull. Amer. Meteor. Soc., 98, 753–766, https://doi.org/10.1175/BAMS-D-15-00171.1.
McKee, T. B., Doesken, N.J., and Kleist, J., 1993, The relationship of drought frequency and duration to time scales. Preprints, Eighth Conference on Applied Climatology, Anaheim, CA, American Meteorological Society, p. 179–184.
The CSI is a standardized probability index. A value of zero indicates historical mean salinity, and positive and negative values represent increasingly fresh and saline conditions, respectively. The CSI uses the same classification scheme as the U.S. Drought Monitor for high saline, or drought, conditions.
| Coastal Salinity Classification | Description | CSI Values | Icon | Cumulative Percentage |
|---|---|---|---|---|
| CD4 | Exceptional salinity conditions | -2.00 or less | 2 | |
| CD3 | Extreme salinity conditions | -1.99 to -1.60 | 5 | |
| CD2 | Severe salinity conditions | -1.59 to -1.30 | 10 | |
| CD1 | Moderate salinity conditions | -1.29 to -0.80 | 20 | |
| CD0 | Abnormal salinity conditions | -0.79 to -0.50 | 30 | |
| Normal | Normal salinity conditions | -0.49 to 0.50 | 70 | |
| CW0 | Abnormal freshwater conditions | 0.51 to 0.80 | 80 | |
| CW1 | Moderate freshwater conditions | 0.81 to 1.30 | 90 | |
| CW2 | Severe freshwater conditions | 1.31 to 1.60 | 95 | |
| CW3 | Extreme freshwater conditions | 1.61 to 2.00 | 98 | |
| CW4 | Exceptional freshwater conditions | 2.01 or more | 100 | |
| Not Available | Missing Data |
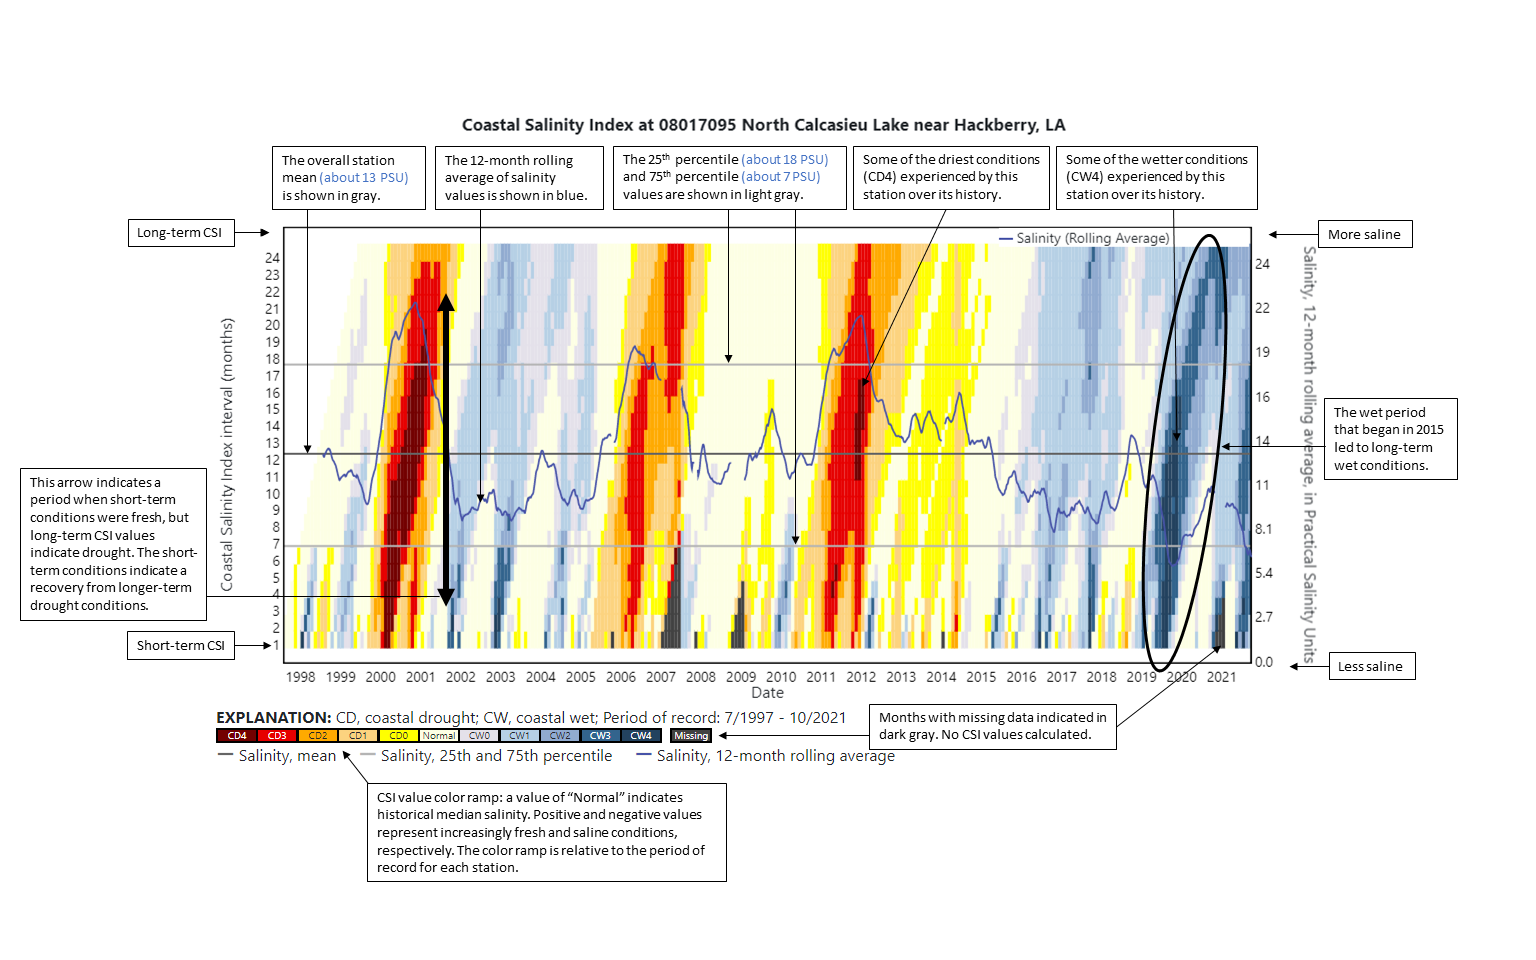
CSI stacked graphs allow the user to evaluate short (1-month) to long (24-month) conditions in one graph.
Click the image to view a larger version.
Title: Estuarine salinity extremes: Using the Coastal Salinity Index to quantify the role of droughts, floods, hurricanes, and freshwater flow alteration
This is a highlight for this paper: https://doi.org/10.1016/j.ecss.2023.108445
Estuaries are highly productive coastal environments that provide critical ecosystem services, such as carbon storage, coastal storm protection, nutrient cycling, fishery habitat, and recreational opportunities. However, as transition zones between marine, freshwater, and terrestrial environments, estuaries are highly vulnerable to changes in the frequency and intensity of extreme events. Extreme events such as droughts, hurricanes, floods, and freshwater flow alterations can drive diverse and rapid changes in estuarine salinities that have significant effects on plants and animals found in estuaries. As the frequency and intensity of extreme events are expected to increase in the future due to climate change, ecologists and resource managers will need standardized indicators for characterizing and monitoring changing salinity conditions in coastal ecosystems. In response to this need, the Coastal Salinity Index (CSI; Conrads and Darby 2017) was developed as a tool for characterizing salinity conditions in coastal surface-water bodies.
In a new NIDIS-funded study in Estuarine, Coastal and Shelf Science, U.S. Geological Survey researchers applied the CSI to 22 years (1998-2020) of long-term salinity data from four hydrography stations distributed throughout an estuarine salinity gradient to understand the impacts of extreme events on salinity regimes in the Barataria Estuary in southeast Louisiana.
The results of this study demonstrate how the CSI can be used to place salinity levels within a historical context and quantitatively compare the impacts of extreme events between areas with varying salinity regimes. The authors identified 10 events between 1998-2020 that produced extreme salinities, including two droughts, five hurricanes, three floods, and one freshwater diversion. The droughts of 2000 and 2006 caused surface water salinities to increase substantially throughout the estuary. The effects of hurricanes were highly variable, with some storms leading to elevated salinities throughout the entire estuary (e.g., Hurricanes Katrina and Rita in 2005), whereas other storms led to elevated salinities for some but not all stations (e.g., Hurricanes Gustav and Ike in 2008 and Hurricane Isaac in 2012). The opening of a freshwater river diversion in 2010 contributed to fresher conditions throughout the estuary and appeared to reduce or eliminate the increases in salinity that normally occur during the summer, although these effects were short-lived. Mississippi River floods in 2008, 2011, and 2019 reduced salinities throughout the estuary, but the effects were most pronounced in the lower estuary compared to the upper estuary. Collectively, the results of this study advance understanding of the influence of extreme events on estuarine salinity regimes. These analyses also highlight the value of the CSI for identifying periods with extreme salinities (i.e., extreme high or low salinities) via calculations that place salinity levels within and across estuaries within a historical context.
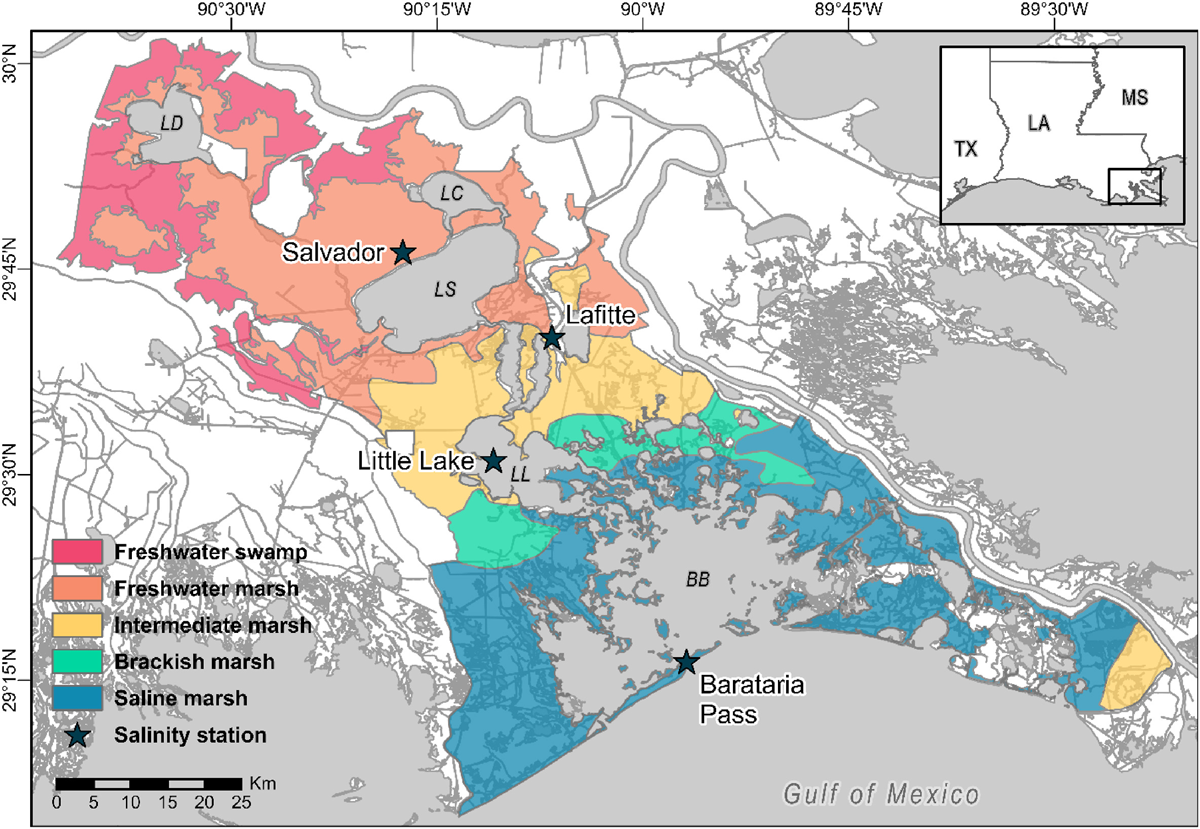
Figure caption: Map of the Barataria Estuary in the Mississippi River Deltaic Plain in southeastern Louisiana (USA). Stars denote the location of the four salinity stations included in this study: Salvador, Lafitte, Little Lake, and Barataria Pass. The two letter labels in italics represent major waterbodies in the basin: LD = Lac des Allemands, LC = Lake Cataouache, LS = Lake Salvador, LL = Little Lake, and BB = Barataria Bay.
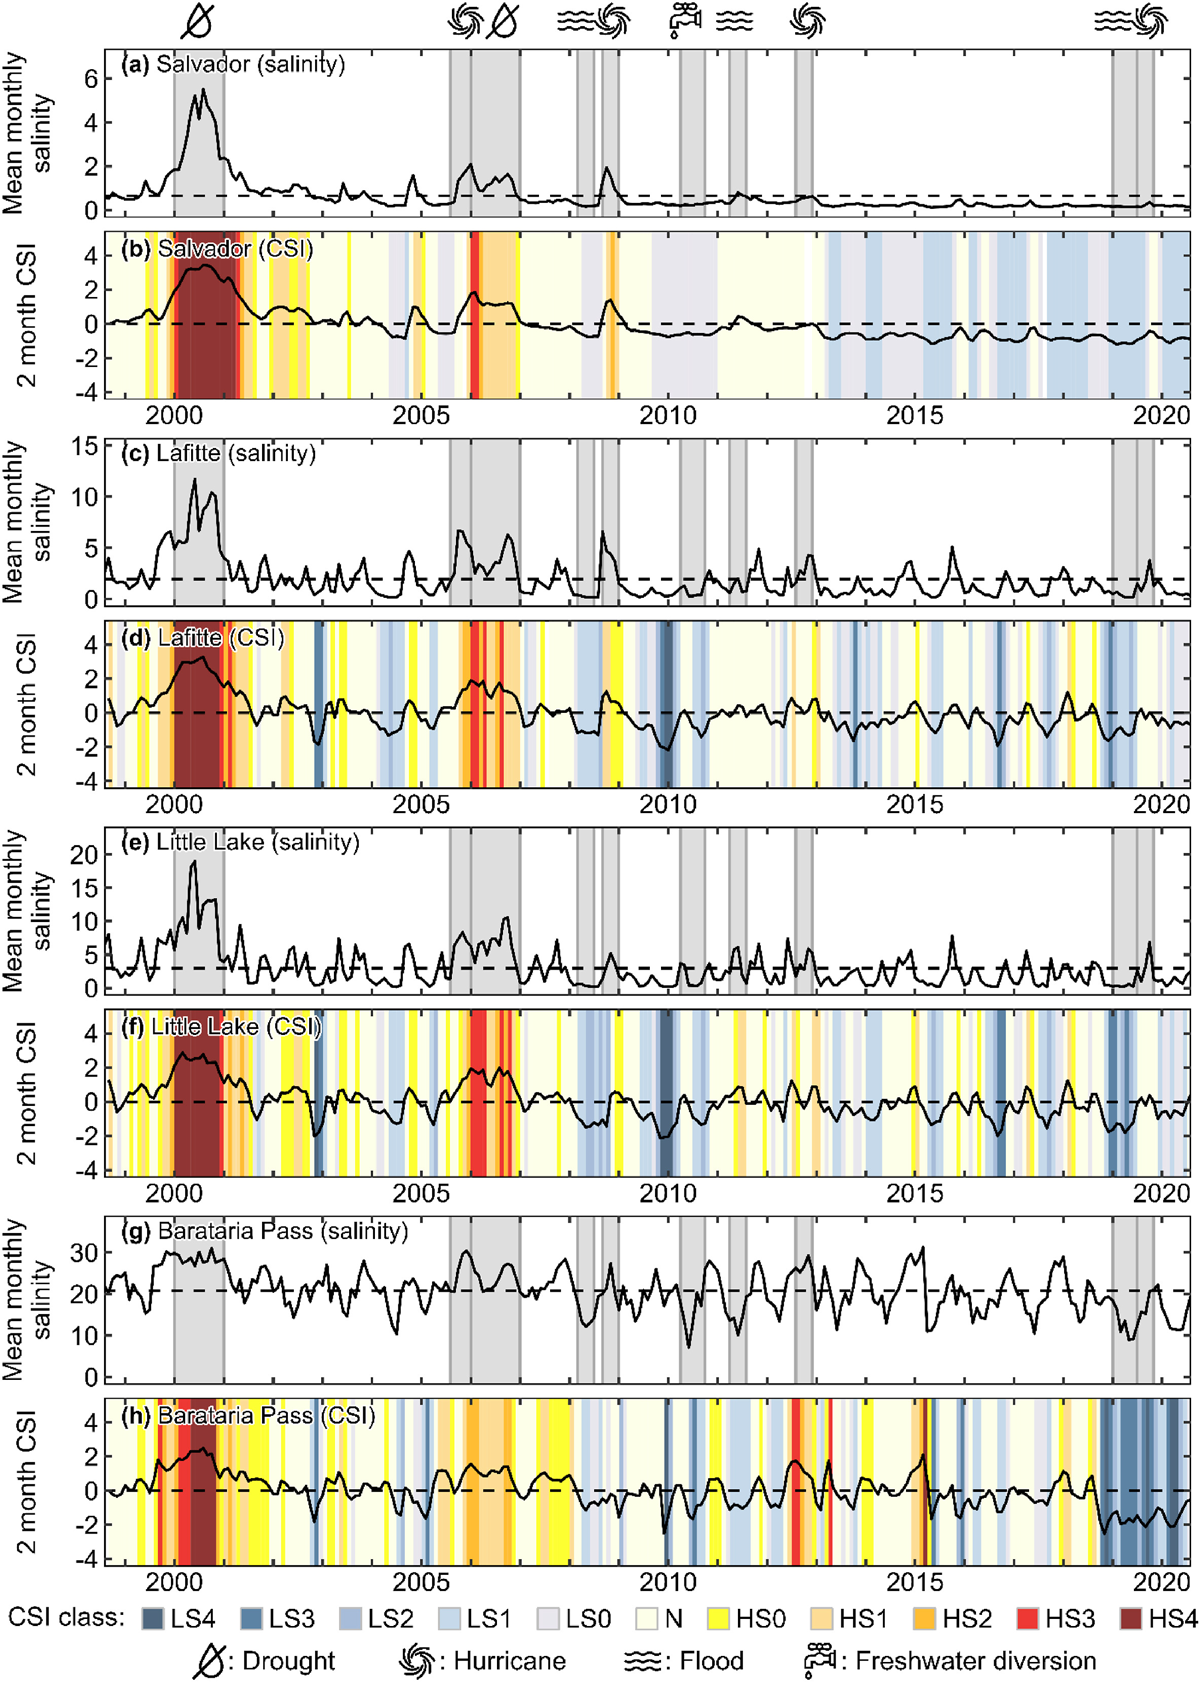
Figure caption: Long-term mean monthly salinity (practical salinity scale) and 2-month Coastal Salinity Index (CSI) values at each salinity station: Salvador (a, b), Lafitte (c, d), Little Lake (e, f), and Barataria Pass (g, h). The background colors in the CSI panels reflect the CSI classes noted in the legend. HS indicates high salinity, LS indicates low salinity, and N indicates normal salinity. Horizontal dashed lines on the salinity panels (a, c, g, and h) represent the mean monthly salinity for each site, whereas horizontal dashed lines on the CSI panels (b, d, f, and h) represent a CSI value of 0. The time periods for extreme events are shown with the vertical grey boxes. The type of extreme event (i.e., drought, flood, hurricane, or freshwater diversion) is denoted with symbols on top of the figure and the accompanying symbol legend at the bottom of the figure.
Real-time data are preliminary or provisional and are subject to revision. They are being provided to meet the need for timely best science. The data have not received final approval by the U.S. Geological Survey (USGS) and are provided on the condition that neither the USGS nor the U.S. Government shall be held liable for any damages resulting from the authorized or unauthorized use of the data.
Website content does not necessarily reflect the views and policies of the National Estuarine Research Reserve System (NERRS) or the U.S. National Park Service (NPS).
![]() Questions concerning the CSI? Know of additional datasets that should be considered? Contact Matt Petkewich at mdpetkew@usgs.gov.
Questions concerning the CSI? Know of additional datasets that should be considered? Contact Matt Petkewich at mdpetkew@usgs.gov.
![]() Questions about the CSI R package? Contact Bryan McCloskey at bmccloskey@contractor.usgs.gov.
Questions about the CSI R package? Contact Bryan McCloskey at bmccloskey@contractor.usgs.gov.
![]() Questions or problems with the web pages? Contact the development team at gs-w-sawsc_webmaster@usgs.gov.
Questions or problems with the web pages? Contact the development team at gs-w-sawsc_webmaster@usgs.gov.